We use cookies to enhance your experience. Basic cookies are essential for the proper working of this website. For example, they save your language preferences. They also help us gather anonymous information about the use of our site. More information in our Cookie Policy.
Discretionary Management

Delegate
You entrust investment decisions to a team of experts. This to help ensure that decisions are made at the right time, in line with your objectives, situation, investment horizon and risk profile.
Expertise
A dedicated portfolio manager is responsible for managing your assets according to your needs and in accordance with your objectives, situation, investment horizon and therefore your risk profile.
Bespoke
You describe your needs, expectations and ambitions and we propose a solution adapted to your objectives, situation, investment horizon and therefore your risk profile.
Rigorous method
Your portfolio manager adopts a rigorous management approach and regularly checks the different securities in your portfolio.
Transparency
You will receive a report including a wealth assessment and the performance of your investments.
Follow-up
Our risk managers monitor the implementation of the investment strategy and assess the risks associated with your portfolio.
What is a discretionary management mandate?
You have neither the time, need nor desire to manage your investment portfolio yourself, but you wish to be invested in financial markets.
By signing a discretionary management mandate, you fully delegate management of your investments to a team of professionals. But first we determine with you what your goals, investment horizon, amount you wish to invest and risk profile are.
Our experts then manage your portfolio for you, taking advantage of opportunities on the market and regularly reviewing its performance with you.
A mandate adapted to your financial goals and circumstances.
We determine your investor profile together in order to build a portfolio that best matches your goals, profile and financial circumstances. To do this, we take into account several factors, including:
- expected investment duration,
- the level of risk you are prepared to take,
- the potential performance that you expect from your initial investment,
- your sustainability preferences.
You will be assigned one of the five profiles below once you have completed this preliminary step with the help of your own Personal or Private Banker. This profile will clearly reflect your main preferences in terms of risk and investment goals.
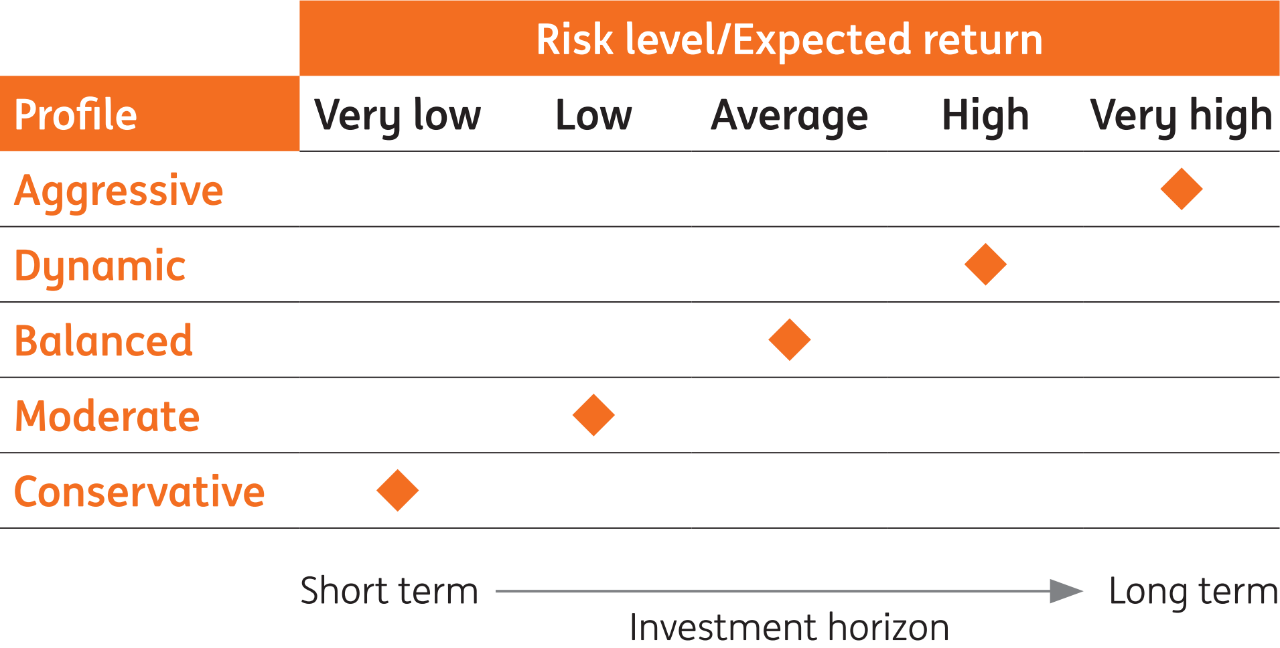
The image shows a table entitled "Level of risk/expected return". The table is structured along two axes. The vertical axis lists the different investment profiles: Aggressive, Dynamic, Balanced, Moderate and Conservative. The horizontal axis indicates the expected level of risk/return, ranging from Very Low to Very High. Each investment profile is represented by dots placed in the columns corresponding to the expected level of risk/return. At the bottom of the table, a text indicates "Investment horizon" with an arrow going from "Short term" to "Long term".
The table explains that return and risk are linked. The higher the expected return, the higher the risk. The level of risk/return correlates with the risk profile:
- aggressive profile: very high level of risk/expected return
- dynamic profile: high level of risk/expected return
- balanced profile: medium level of risk/expected return
- moderate profile: low level of risk/expected return
- conservative profile: very low level of risk/expected return
The table also shows a correlation between the level of risk/expected return and the investment horizon: with an aggressive profile and a very high level of risk/expected return, the investment horizon is long-term. Conversely, with a conservative profile and a very low level of risk/return, the investment horizon is short-term.
Choice of the most suitable investments.
A team of investment experts then manages your portfolio for you. Our team uses its expertise and knowledge to allocate the financial products best suited to your profile and the type of mandate chosen.
Risk management.
Having a team of experts at your side enables you to control your risk. Indeed, your manager will work on your portfolio based on the information you have given them and your profile. They then have room for manoeuvre that enables them to be highly responsive to the macroeconomic environment in particular, and to be able to manage your risk and desired return.
All investments involve risks such as the risk of loss of capital, market risk, interest rate risk, credit risk and liquidity risk. Your level of exposure to these risks is determined and communicated to you when you define your investor profile.
Wide range of mandates.
We offer different types of mandates to match your profile and needs. These may consist solely of ING funds or financial products enabling you to build a bespoke portfolio.
High-end services.
Rates & Conditions.
All rates and conditions of our mandates are available on request.
Please contact your Private Banker directly for any other information you may require or send us an email.
Documentation
My Money
Articles that might interest you
-
Investment products and funds

If you have followed the previous posts you are an advanced saver by now! If you have managed to set aside some spare savings that you will not need in the short term you should continue to read this article…
-
What owning shares in a company actually means

A share is a unit of ownership delivered by a capital company. Holding one of several shares (being a shareholder) means that you own a part of the company’s capital but you are not held personally liable for the company’s debts.